There are variety of ways to approach value-based oncology care
As a technology enabled oncology management services organization (MSO), OPN aids with administrative and management tasks in the dynamic healthcare environment. OPN provides seamless coordination between payors, physicians, and patients. This leading community-based oncology network delivers value-based oncology care and manages costs efficiently. OPN generally offers two financial models, the Network Model and the Care Management Model.
Network Model
OPN’s Network Model is based on fully capitated risk (100% upside and downside risk to OPN) for oncology services via high-performing networks of oncology providers through partnerships it develops. 1.2 million lives are currently managed under capitated arrangements by this preferred model. For over 20 years, OPN has worked with Health Plans and Primary Care Risk Bearing Organizations (RBOs) on a capitated basis to manage costs and improve the quality of cancer care. It offers sophisticated expertise in developing alternative physician payment models for oncology care. OPN is contracted across numerous markets with capitated chemotherapy contracts that encompass Medical Oncology professional fees and drugs. Other versions of the contract can include Total Cost of Oncology Care (radiation oncology, labs, and diagnostic).
Care Management Model
The OPN Care Management Model offers a Utilization Review Accreditation Commission (URAC) accredited Care Management platform for payers and/or oncology providers who are not yet ready to take capitated risk. This model is operated under different value-based contracting methodologies, ranging from full risk to gain share. OPN currently contracts with more than 30 health plans and risk bearing provider organizations in California, Wisconsin, and Indiana using this model, and is developing additional operations in other states.
Flexible Integration
OPN’s financial models are designed to be flexible, meeting payers anywhere on the risk continuum. Regardless of model, OPN provides a value-based oncology clinical platform with focused expertise in several areas:
- Developing accessible oncology networks of community-based physicians, hospital and system employed physicians, and academic and tertiary care physicians
- Streamlining and administering value-based physician payment models including gain share and full risk/capitation
- Deploying care management services to manage the Total Cost of Oncology Care consistent with evidence-based community standards, NCCN guidelines, and OPN’s internal data-driven standards
- Delivering population-based reporting of data analytics for both upstream payers and downstream providers
- Coordinating and managing clinical trials within the community
- Utilizing appropriate palliative care and hospice services
Case Studies
OPN has a 20-year history of increasing access, quality, and outcomes while reducing costs, regardless of location and model. OPN’s oncology expertise and history has resulted in cost reductions of at least 15-20% in previously unmanaged populations and 7-10% in already managed populations.
Care Management Model Case Studies
Large Integrated Health System
OPN was engaged by a large integrated health system to provide care management services for a previously unmanaged population the basis of Total Cost of Oncology Care (TCOC). TCOC includes professional fees, drug cost (Part B chemotherapy and chemotherapy support drugs), lab testing including genetic and molecular testing, radiation oncology, and diagnostic services relating to oncology care.
Prior to OPN’s engagement, the health system had established a high-quality network of employed and contracted oncologists to provide care for roughly 50,000 Medicare Advantage enrollees. Like health systems across the U.S., the physician incentives were driven by work relative value units. In coordination with the health system, OPN created a gain share financial model incentivized with physician bonus pools for appropriate management of TCOC.
To achieve population health goals, OPN deployed its care management process with the health system to review authorizations that meet specific criteria of cost and quality indications. During the first year, OPN performed over 2,800 targeted authorization reviews (see Table 1). Initial intervention rates exceeded 40% in high- cost treatment regimens. Intervention rates have trended down to 20-25% in subsequent years, indicating a change in prescribing behavior and practice patterns.
The top intervened drug class was checkpoint inhibitors such as Opdivo and Keytruda (pembrolizumab). Keytruda had an intervention rate of nearly 30%, resulting in ~$2M in estimated cost avoidance. This form of immunotherapy has recently gained broad approval for multiple cancer types and indications, resulting in a significant increase in spend nationally. OPN can direct patients to a number of active clinical trials which may include Keytruda with the availability for more with through advanced clinical trials team. OPN’s ability to enroll patients in these trials and evaluate appropriate use of novel immunotherapies drove significant cost savings to the health system and access to novel therapeutics for patients. Opdivo has a similar story line contributing to the escalating costs of oncology care. When compared to Magellan’s PMPM for Opdivo, OPN’s Opdivo PMPM spend is 4x less.
| Authorization Type | Intervention Rate | Est. Cost Avoidance |
|---|---|---|
| Hematology/Oncology | 32% | $5,400,000 |
| Genetic/Molecular Testing | 25% | 600,000 |
| Radiation Oncology | 62% | 966,000 |
| Radiology | 21% | 1,129,000 |
| Total | 32% | $8,095,000 |
Midwest Health Plan
OPN has an ongoing contract for more than 3 years with a Midwest health plan that has a well-managed population and offers insurance plans for groups and individuals as well as benefit plan administration for businesses. The financial model was service-based addressing hematology, medical oncology, and radiation oncology. The client expressed concern of off-label treatments in medical oncology, and potential billing non-compliance in radiation oncology. To address these concerns, OPN has implemented a quarterly physician feedback component and added robust data analysis to the system. As a result, costs were successfully reduced while quality, outcomes, and patient experience were improved through a constant feedback loop. Despite three years of partnership, improvement continues (see Table 2).
| Year | Authorization Type | Intervention Rates | Est. Cost Avoidance |
|---|---|---|---|
| 2018 | Hematology/Oncology | 17% | $2,150,000 |
| Radiation Oncology | 26% | 520,000 | |
| 2019 | Hematology/Oncology | 13% | 2,100,000 |
| Radiation Oncology | 32% | 810,000 | |
| 2020 | Hematology/Oncology | 16% | 1,550,000 |
| Radiation Oncology | 32% | 450,000 | |
| Total: | 19% | $7,580,000 | |
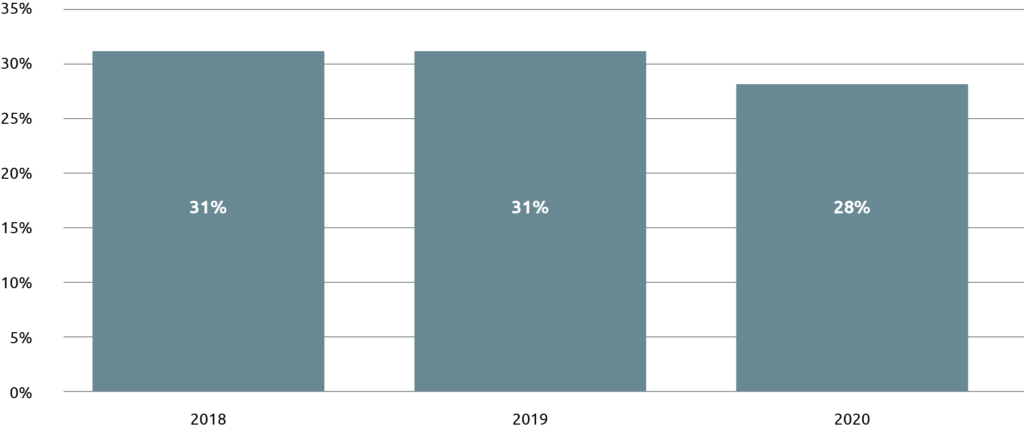
OPN’s care management model provides direct feedback for each authorization that has a corresponding intervention. This includes alternative treatment recommendations and a clinical and scientific basis behind the decision. The education component of OPN’s model allows physicians to learn and adapt to OPN’s adherence to value and evidence-based standards OPN. At the start of a new client contract, intervention rates hover around 30% due to low compliance with value-based aims (see Figure 1). With time physician authorization intervention rates normally decrease. OPN’s cooperative approach to these cases encourages a more value focused approach by physicians. Even as physician behavior adapts to the value approach, improvement continues as OPN’s long tenure in oncology care and its significant expertise by way of its subspeciality committee assists in maintaining a more cost-effective approach.

Network Model Case Study
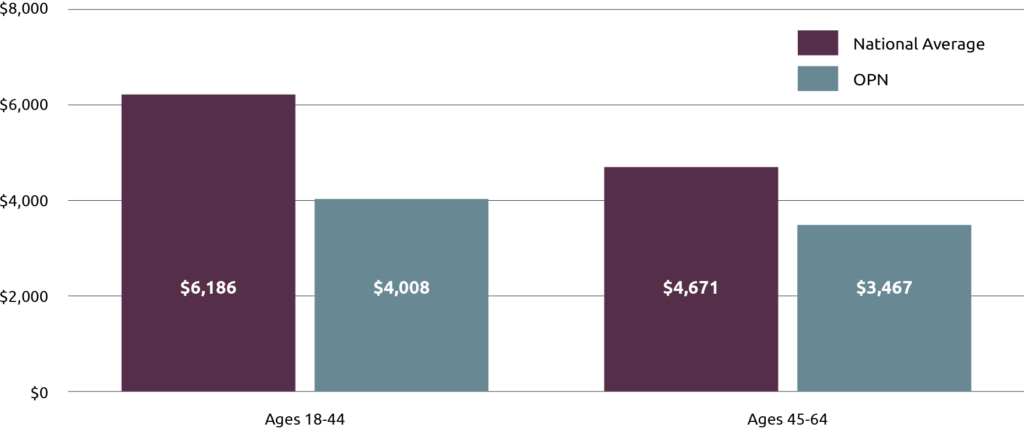
OPN’s average spend on breast cancer patients actively receiving a chemotherapy/ immunotherapy is approximately 15-30% less than the national average (see Figure 2). This trend is in large part due to OPN’s comprehensive approach to oncology management. The implementation of evidence-based internal case reviews and provider benchmarking with real-time quality/cost-effectiveness metrics have a tremendous impact. These tools allow network providers to identify their own divergence in practice patterns, compare their average-cost of cancer care in terms of cancer-subtype and stage with other providers in the network and identify off-label therapies that were not validated by medical literature. This empowers these oncologists to make insightful, data-driven and cost-effective treatment decisions that do not compromise quality care. In addition to these management tools, OPN also expanded the use of patient navigators and coordinators to increase care efficiency, improve patient satisfaction, optimize site of care and minimize out-of- network leakage.

National Average Source: Blumen, H., Fitch, K., & Polkus, V. (2016). Comparison of Treatment Costs for Breast Cancer, by Tumor Stage and Type of Service. American health & drug benefits, 9(1), 23–32.
Conclusion
For the past 20 years, OPN has served national and regional health plans, integrated delivery systems, and capitated primary care groups with financial risk for oncology care interested in aligning with an oncology MSO. Its payer relationships average more than 15 years. OPN works with independent, affiliated and employed provider groups on an IPA-basis that want to deliver value-based population health. OPN has experience servicing Commercial, Medicare Advantage, and Managed Medicaid lines of business for these customers.